| COUNTRY | EXPORTS 2016/2017 | RANK | EXPORTS 2015/2016 | RANK | EXPORTS 2014/2015 | RANK | EXPORTS 2013/2014 | RANK |
|---|---|---|---|---|---|---|---|---|
| CHINA | 36148.3 | 1 | 29855.0 | 1 | 29640.8 | 1 | 27602.2 | 1 |
| MEXICO | 3665.0 | 2 | 3252.6 | 2 | 3438.8 | 2 | 3194.5 | 2 |
| INDNSIA | 2296.9 | 3 | 2028.6 | 5 | 1875.9 | 5 | 2291.5 | 3 |
| JAPAN | 2137.2 | 4 | 2145.6 | 3 | 2011.4 | 3 | 1826.4 | 4 |
| NETHLDS | 2044.9 | 5 | 2037.7 | 4 | 1879.4 | 4 | 1015.6 | 7 |
| TAIWAN | 1292.7 | 6 | 1232.9 | 7 | 1310.8 | 6 | 1133.6 | 5 |
| GERMANY | 1287.7 | 7 | 1757.5 | 6 | 1005.9 | 7 | 676.1 | 8 |
| BANGLADH | 1050.0 | 8 | 551.0 | 10 | 545.7 | 13 | 160.5 | 21 |
| THAILND | 950.6 | 9 | 424.2 | 15 | 518.2 | 14 | 432.4 | 13 |
| EGYPT | 807.2 | 10 | 295.4 | 19 | 712.4 | 11 | 604.6 | 9 |
| SPAIN | 731.8 | 11 | 964.1 | 8 | 852.4 | 8 | 1099.5 | 6 |
| KOR REP | 653.4 | 12 | 480.3 | 13 | 548.1 | 12 | 599.2 | 10 |
14 Forecasting Use of Soybeans
Interested in more? Please let me know by taking the survey!
In the WASDE balance sheet for soybeans there are three use categories. Two account for domestic consumption - Crush, and Feed, Seed, and Residual - while exports make up the third category. The main distinction between cereal grains, like corn, and oilseeds, like soybeans, is that cereal grains are generally ground whole for whatever the end use turns out to be. Most oilseeds, on the other hand, are crushed to extract oil and meal before their ultimate use. Soybean oil is food-grade and can be found on the shelves of any American grocery store. Soybean meal is protein rich and used as an ingredient in livestock feed rations.
In the next sections we will examine historical use patterns of soybeans in the three categories expressed nominally, and as a percent of the concurrent year’s total supply, similar to the organization of chapter 7.
Since this book has taken a closer look at corn production than soybean production, we will ground our discussion of use by first noting the pattern of annual supply of soybeans in recent history.
Figure 1 displays annual soybean production in millions of bushels from 1980-2014. A steadily increasing trend can be observed; supply had roughly doubled since the early 1980s from about 2,300 million bushels to about 4,000 million bushels in 2014.
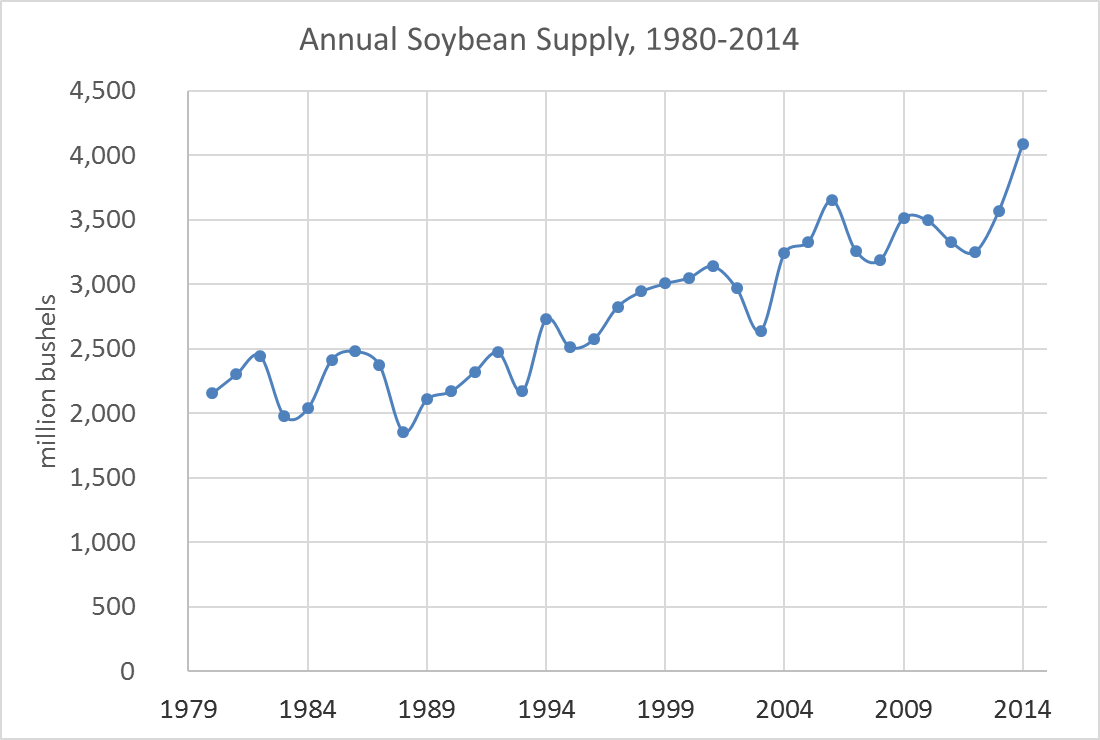
Source: USDA ERS Oil Crops Yearbook
Since soybeans are not consumed whole as food by humans or feed for animals in the U.S., nearly all the soybean supply is crushed domestically or exported.
14.1 Soybean Crush
Figure 2 displays the annual crush of soybeans from 1980-2014. A pronounced upward trend, similar to the trend in soybean supply is observed.
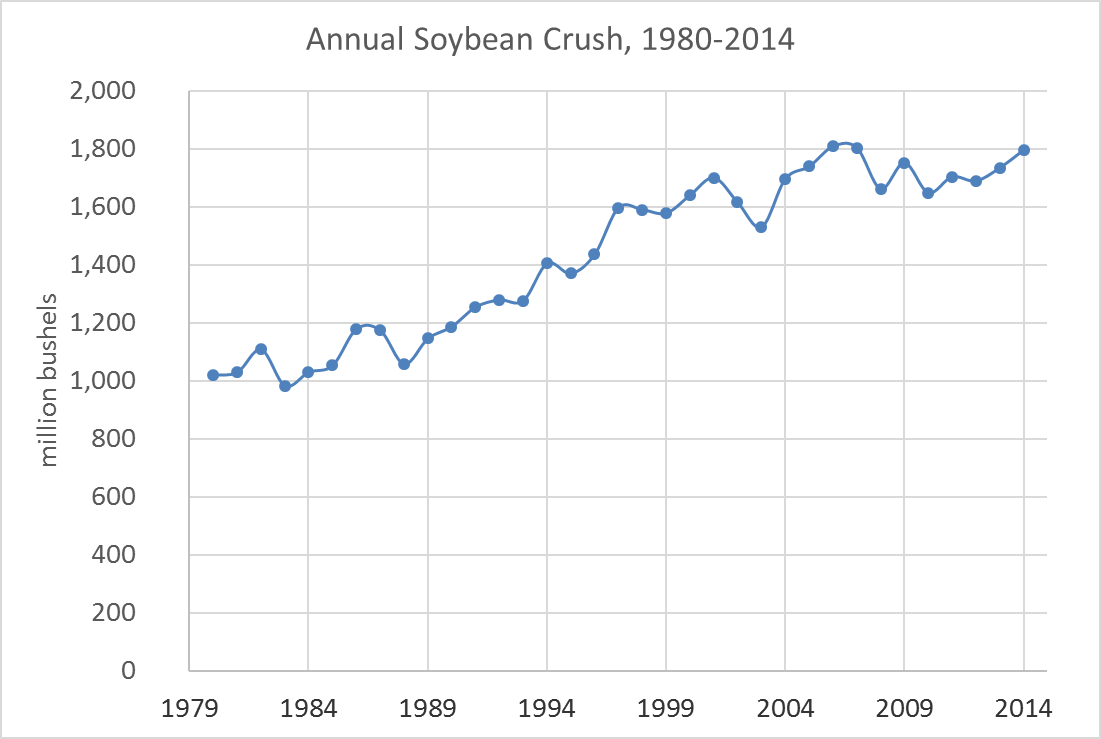
Source: USDA ERS Oil Crops Yearbook
When examining corn use, we saw that the proportion of supply shifted dramatically from other use categories to Food, Seed, and Industrial use due to the increase in ethanol production since 2005. In figure 3, we show soybean crush as a percent of the concurrent year’s total supply. While the bushels of soybeans devoted to the crush is steadily increasing, figure 3 shows that the crush is increasing roughly proportionally. There does not seem to be a shift into or out of the crush category.
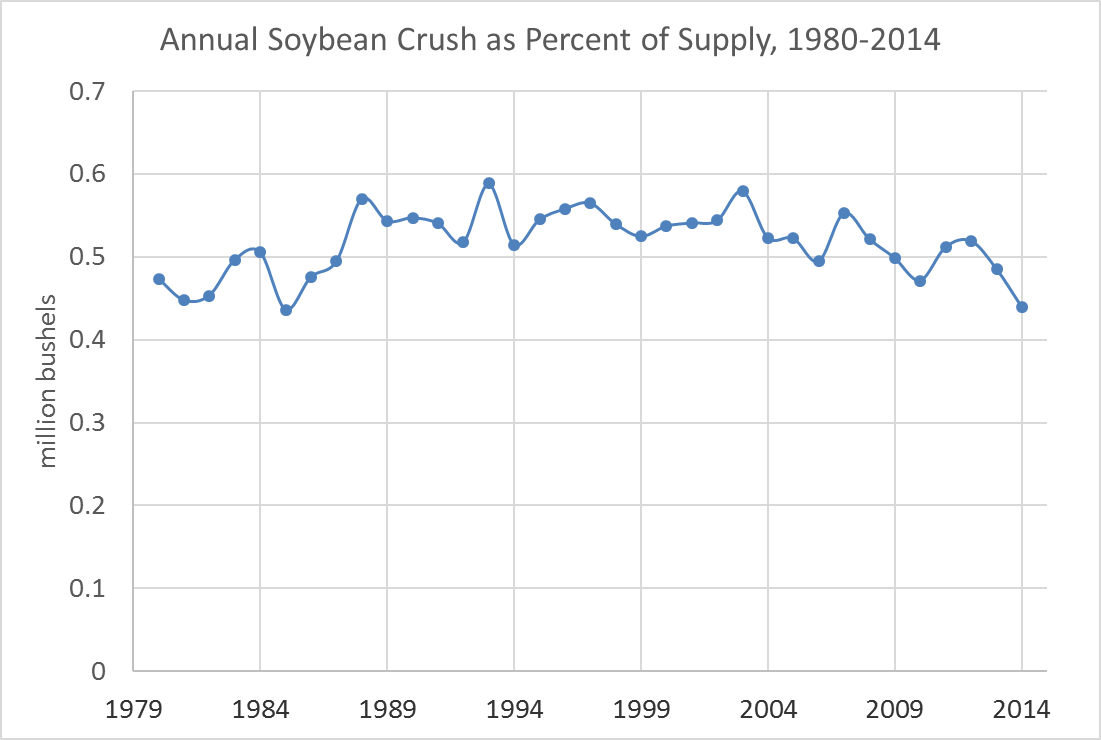
Source: USDA ERS Oil Crops Yearbook
14.2 Exports
Figure 4 displays annual soybean exports. Similar to the crush category, exports are observed to steadily increase over the period from 1980-2014.
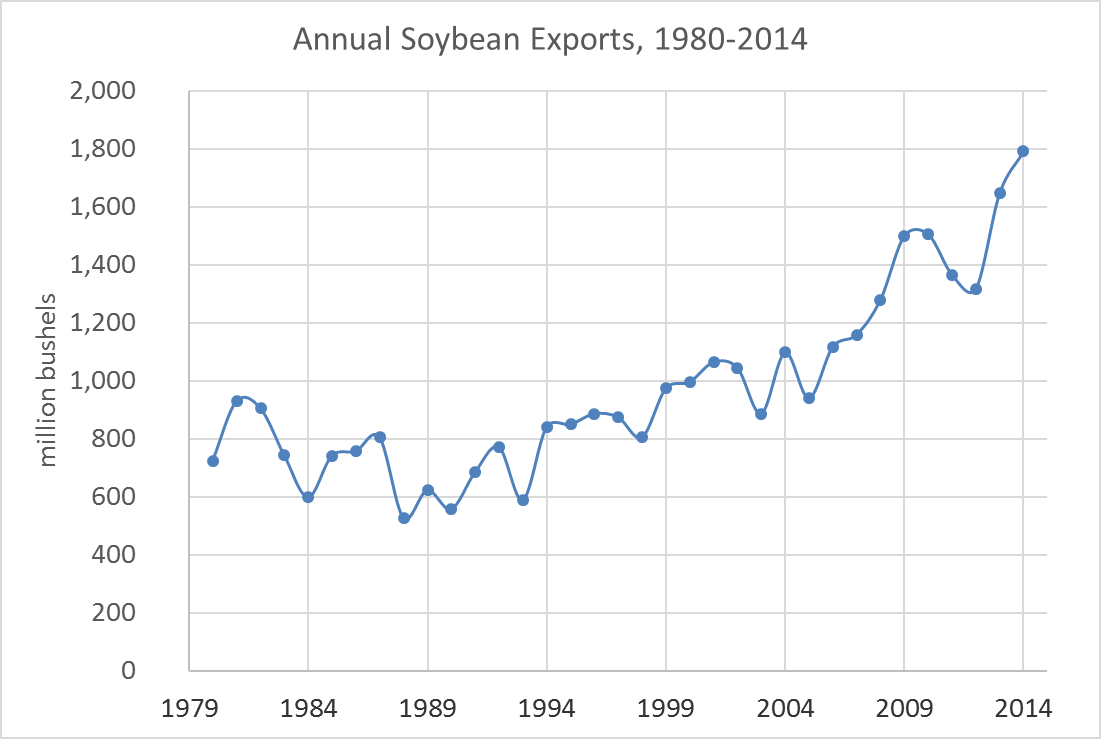
Source: USDA ERS Oil Crops Yearbook
Figure 5 shows soybean exports as a percent of total supply from 1980-2014. Similar to the crush category, the percentage of supply has remained constant.
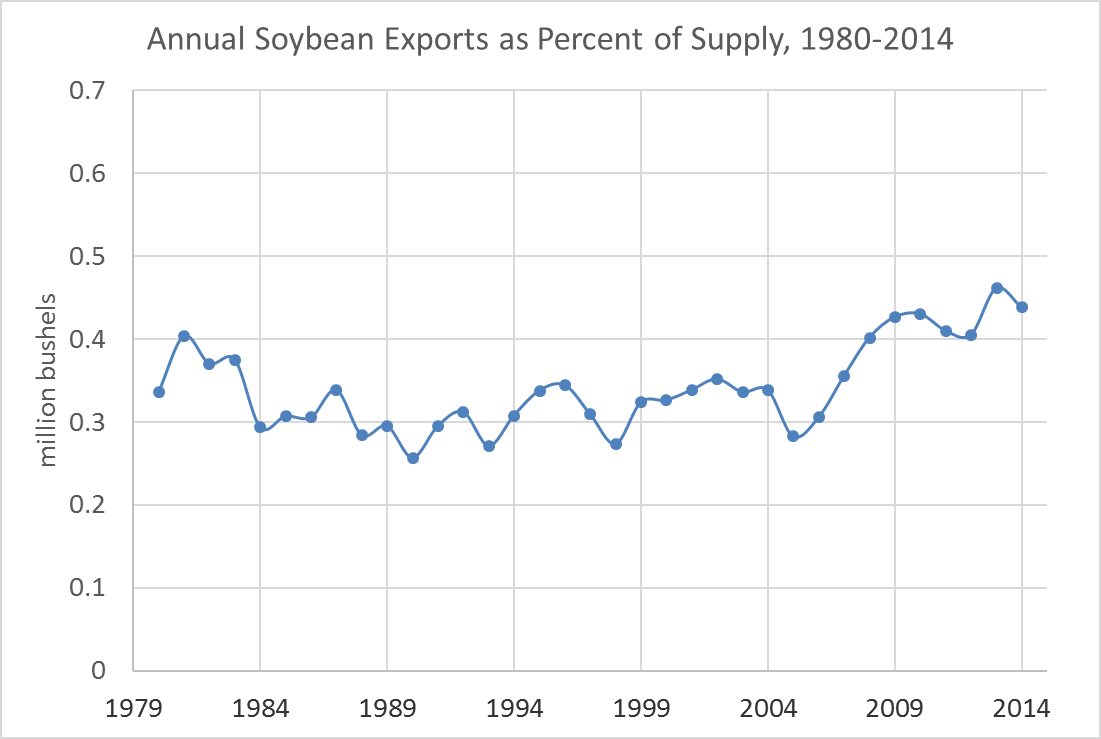
- Source: USDA ERS Oil Crops Yearbook
-
Table 1: Top 10 Importers of U.S. Soybeans 2012/2013 through 2016/2017 Marketing Years, Ranked in Descending Order for Marketing Year 2016/2017 (1,000 Metric Tons)
Source: USDA FAS
Clearly China is the dominant importer of U.S. soybeans. They buy 10 times more than 2nd ranked Mexico. Examining the short history in table 1, you can see that increasing exports of soybeans to China accounts for nearly all of the uptrend in figure 4. In the 2016/2017 marketing year China was the destination of over 60% of U.S. soybean exports.
14.3 Feed, Seed, and Residual
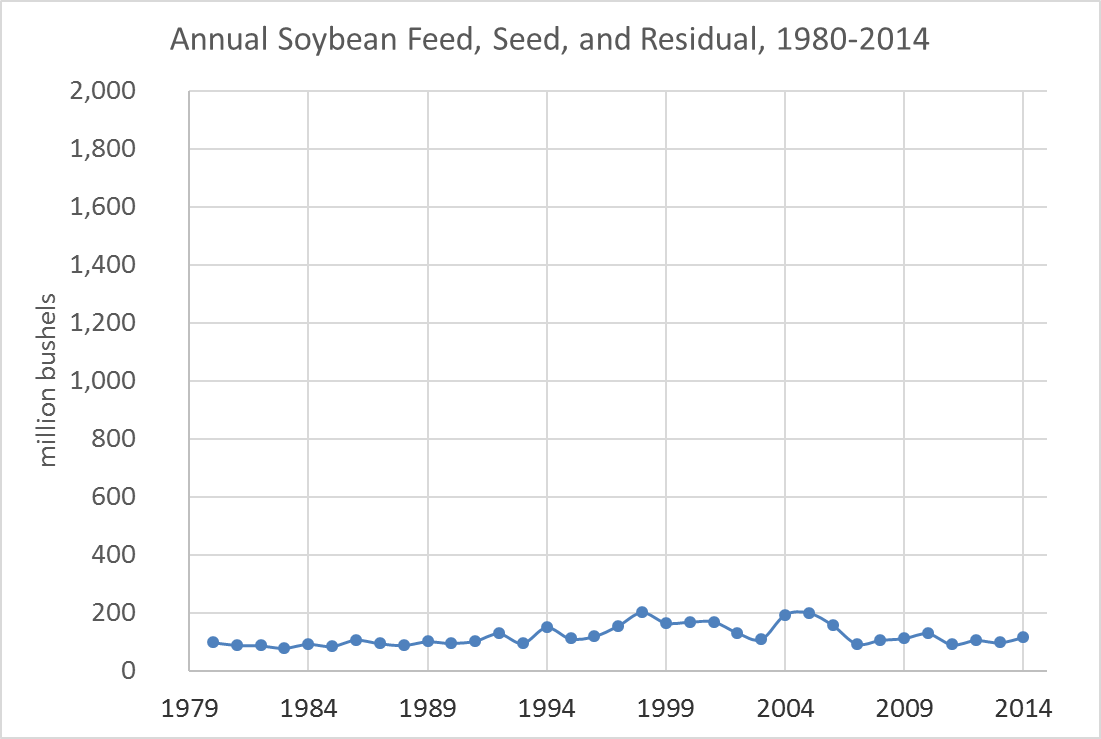
Source: USDA ERS Oil Crops Yearbook
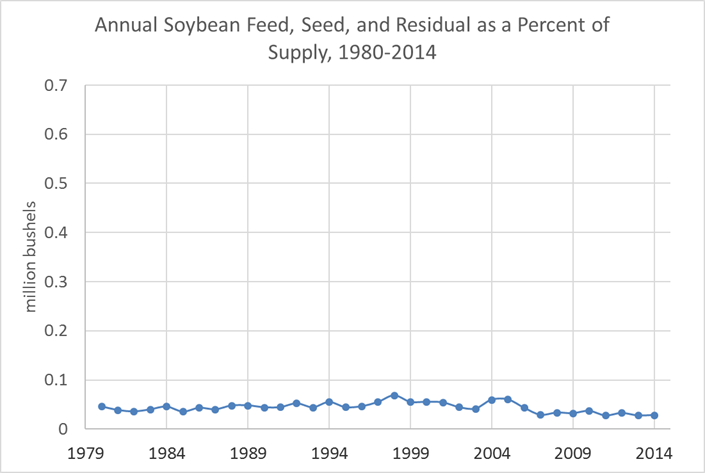
Source: USDA ERS Oil Crops Yearbook
14.4 Price Sensitivity of Use Categories
Soybeans are a bit different from corn because there are only two use categories that are important, crush and exports. The soybean use categories historically have been reliably 50% crush and 50% exports as a percent of supply. In recent years, exports have been increasing both nominally and as a percent of supply. So forecasting demand for soybeans has largely become a matter of forecasting soybean exports.
Recently, with the rise of South American soybean (and corn) production, forecasting exports is a matter of balancing the price of U.S soybeans compared with the price of South American soybeans and the raw demand from our trading partners. China has become the major player in this space, as is evident in table 1.
14.5 Forecasting Use of Soybeans
As we mentioned in chapter 7, keeping track of how much soybeans have been used to date in each category is a useful exercise to determine a reasonable forecast for different use categories of soybeans. As was true for corn, information about the pace of use in each category must be obtained from different sources within the USDA.
Soybeans exports can be followed during the marketing year by following the GIPSA and FAS Export Reporting System as was identified for corn exports in Chapter 7. Also, as identified in Chapter 7 is is useful to tracking Cattle on Feed, Hogs and Pigs, and the Poultry Slaughter, specifically because livestock numbers contribute to demand for soybean meal, which in turn contributes to crush demand.
14.6 Exercises
Skills Learned
A common method for accounting strength of demand: pace of use.
How to directly import data that is hosted on a website so that a .csv file has a url for download
How to work with pivot tables in excel to summarize large data-sets with many factor variables
Compare the pace of export sales in the first few weeks of marketing year 2017/2018 to the pace of export sales in the previous three marketing years. Make inferences about whether this marketing year seems to be getting off to a good start in export sales.
a. Choose FGIS Reports in the Federal Grain Inspection Menu

b. Scroll down and choose Export Grain Totals (Yearly) in the Data and Statistics section - Import the reports for 2014-2017 into excel so we can examine the following marketing years:
a. 2014/2015, 2015/2016, 2016/2017, and 2017/2018 (so far) Create a pivot table that has weeks in the rows, marketing year in the columns, and sums the export sales in each week. Filter by Grain.
Copy and paste special this table into a new worksheet as plain text (so that is not a pivot table).
Delete the data in 2014 prior to September so that we start at the beginning of the marketing year.
Collapse all the marketing year into a single set of 53 rows (so we can compare by marketing year.)
Create a new column on the left side and fill it in with a sequence of 1 to 53, for weeks in the marketing year.
Insert two columns between each marketing year; label them Cumulative Sum and Pace of Export.
Calculate the cumulative sums.
Go find the historical export numbers from old WASDE reports for each marketing year. Enter these values in your spreadsheet somewhere, and convert the million bushel numbers into pounds using the fact that bushel of soybeans weighs about 60 lbs.
Calculate the pace of use by dividing the cumulative sums by the export total for each marketing year.
Plot the pace of use with the Week numbers on the x axis for each marketing year.
Infer whether or not the 2017/2018 export sales are off to a strong start.