Interested in more? Please let me know by taking the survey!
Highlights
- Balance sheet analysis is the most important tool for fundamentals-based price forecasting.
- This chapter covers the format all balance sheets take, and introduces the USDA WASDE balance sheet.
- This chapter shows what affects each row of the balance sheet.
- This chapter provides a timeline of when the rows of a balance sheet can be updated.
Check Your Understanding
- Do you know which cells in the balance sheet must be estimated by the USDA and which can be calculated from other cells in the table?
Fundamental analysis is an assessment of price based on underlying supply and demand factors. Focusing on changes in the relationship between supply and demand allows one to calibrate an informed opinion of the value of the commodity. The main role of the market is to find the value at which supply equals demand - or in other words, the value that ‘clears the market’. The estimated ‘fundamental value’ is simply a forecast, or expectation of, the market clearing price. The goal of any forecasting exercise is to compare the forecast (estimated fundamental value) to the current market price and make decisions accordingly.
If your forecast is above the current market price, that is bullish because your forecast implies the market is undervaluing the commodity - an opportunity to buy low and sell high! If your forecast is below the current market price, that is bearish because your forecast implies the market is overvaluing the commodity - an opportunity to sell high and buy low! This, of course, only works if your forecast is correct, that is, the market eventually agrees and moves into line with your forecast.
Supply and Demand
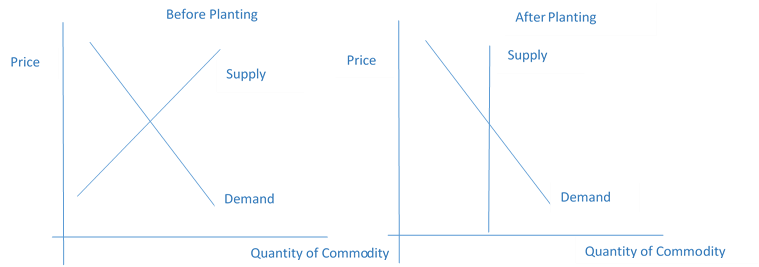
Conducting fundamental analyses involves taking into account all the factors that determine supply, demand, and ultimately, prices. For grain markets there are basically two supply models to keep in mind: preplanting and post planting. Below we display both.
The intuition here is simply that before planting, the final supply for the crop can be affected by farmers changing their intentions about how many acres to plant. Once the crop has been planted, supply is essentially fixed, except for the uncertainty that remains due to realized yields. To summarize, things that affect the supply of a commodity are outlined below.
Supply is Affected by:
Acreage
- Prices of crops competing for acreage
- Pre-Plant Weather
Yield
Government Policies
- Acreage
-
Before planting, farmers plan how much acreage to devote to each commodity, thus determining the baseline expected production level. Before summer weather is revealed, expected production is simply Acreage X Trend Yield. In the Corn Belt, where planting decisions amount to deciding how to divide acres between corn and soybeans, their relative prices play a large role in the farmer’s decision. If futures prices indicate planting soybeans will be more profitable than planting corn, farmers will plan to devote more acres than usual to soybeans, for example. Weather can be an important determinant of acreage decisions as well. The most ardent planting intentions of a farmer can be derailed by persistent wet weather. An unusually rainy planting season can reduce planted acres from intentions. Before the crop is actually in the ground, the supply of grain is relatively elastic.
- Yield
-
After the crop is planted supply is quite inelastic, but there is still considerable uncertainty related to how much the crop will yield; this is largely determined by weather during the growing season.
- Government Policies
-
The government has been heavily involved in Agriculture in the United States since the great depression of the 1930’s. There have been programs that guarantee a minimum price, programs that guarantee minimum revenue, and various incarnations of crop insurance programs. Occasionally these favor the production of one type of crop over another. When this happens, farmers predictably respond by planting more of the crop treated more favorably by the program.
Demand is Affected by:
- Consumer Income
- Exchange Rates
- Consumer Income
-
This one is straight from economics 101. When people have more money, they will spend it on goods. This means increased demand for commodities and their derived products. This includes foreign income, since exports are a big component of demand for commodities in the United States. Rising incomes usually means rising consumption of meat, which increases the demand for commodities like corn, soybeans, and even wheat that are used as animal feed.
- Exchange Rates
-
Exchange rates also affect demand through their influence on exports. For example, if the U.S. dollar is weak, then consumers in other countries can buy dollars cheaply - giving them more purchasing power for goods denominated in dollars.
Balance Sheet
Most fundamental analyses rely on maintaining balance sheets of a commodity for a country, region, or the world. The approach is to maintain a careful accounting of how much supply exists and how much of the commodity has been used. Then through various means we will explore later, one arrives at a price that is expected to ration remaining supplies across competing uses.
The Marketing Year and Balance Sheet Forecasting Schedule
Balance sheet analysis is often organized by marketing year. Since production happens once per year, the marketing year is defined to begin in the first month the commodity is harvested and ends with the following year’s harvest. The table below makes note the month on which marketing years begin for several crops.
Table 1. Beginning of Marketing Year by Crop. (Source NASS Timetables)
| Corn |
September |
| Soybeans |
September |
| Spring Wheat (Chicago) |
August |
| Winter Wheat (KC) |
July |
Forecasting supply and demand for any given marketing year begins well before harvest - nearly a year in advance, in fact. Table 2 below follows the typical forecasting schedule with the 2017/2018 marketing year. Note that is for the marketing year that begins with harvest in September of 2016.
Table 2: Forecasting Calendar for 2017/2018 Marketing Year
| Fall 2016 |
The first forecasts of supply and use based on , trend forecasts, recent history, economic relationships |
| Spring 2017 |
Update supply forecasts based on USDA acreage surveys. |
| Summer 2017 |
Update supply forecasts based on weather and USDA crop and stocks reports |
| Fall 2017 |
Update supply forecasts as yield uncertainty is resolved through harvest reports and USDA production reports |
| - Summer 2018 |
Continue to update supply forecasts based on USDA production revisions, southern hemisphere production, stocks, and use reports. |
Southern Hemisphere Production
Production of corn, soybeans, and other commodities in the southern hemisphere (most notably in Brazil and Argentina) has grown rapidly over the last ten to fifteen years, and has impacted global commodity markets tremendously. Since southern hemisphere production occurs in the middle of marketing years organized by northern hemisphere harvest, there is an uncertain additional supply that must be forecast and updated to keep an accurate global balance sheet.
Uncertainty
Even careful accounting of supply and demand factors that make up the balance sheet leaves a tremendous amount of uncertainty in the market. Demand can be difficult to forecast, and can sometimes change dramatically. The USDA keeps careful track of stocks, but we only get stocks estimates once a quarter. Between Grain Stocks reports there is always a great deal of speculation as to the pace of consumption and whether we are eating into stocks at a faster or slower pace than expected. Analysts talk about whether the market is on pace to achieve the forecast level of ethanol crush, soybean crush, or exports. Surprises in any of these components can lead to rapid corrections in the commodity markets.
Coming up with a Price
Balance sheet forecasting is definitely as much art as it is science. It involves keeping track of the rate of use of commodities to see how much a need there will be to ration late in the marketing year while waiting on harvest and new supplies. One should intuitively see that the forecasted ending stocks is a measure of scarcity of the commodity and therefore should be negatively related to price (i.e., tight ending stocks go along with high prices). One needs to pin down the exact nature of this relationship in order to form a meaningful forecast of price from a commodity balance sheet. We will discuss this process in more detail in a later chapter.
Readings
- Balance Sheet Projections for the 2015-16 Corn Marketing Year
-
This farmdoc daily article was written in February of 2015. This is well before spring planting of corn and soybeans in the United States. However, farmers during this time are actively planning for planting season - prepping equipment, fertilizing and preparing ground, and buying seed. Good lays out the groundwork for early forecasts of the 2015/2016 marketing year balance sheet. This article is published two days before the February 2015 WASDE report, and Good provides context upon which market expectations for the WASDE report can be based upon.
Good, D. “Balance Sheet Projections for the 2015-16 Corn Marketing Year.” farmdoc daily (5):23, Department of Agricultural and Consumer Economics, University of Illinois at Urbana-Champaign, February 9, 2015.
- Projecting the 2015-16 Corn Balance Sheet and Price Implications
-
In this reading Good and Irwin break down the USDA’s April 9th WASDE report and offer their own projections that differ slightly from the USDA’s projection that came out a week earlier. Pay close attention to why their price estimate is higher than the USDA’s.
Good, D., and S. Irwin. “Projecting the 2015-16 Corn Balance Sheet and Price Implications.” farmdoc daily (5):70, Department of Agricultural and Consumer Economics, University of Illinois at Urbana-Champaign, April 16, 2015.
Exercises
Copy and paste the corn and soybeans balance sheets into a spreadsheet.
- In the cell next to = Total Supply, manually add the cells needed to reproduce the ‘=Total Supply’ number.
- in the cell next to = Total Consumption, manually add the cells needed to reproduce the = Total Consumption number.
If you were making a forecast in July 2015 for the 2014/2015 marketing year balance sheet, which columns (if any) should remain fixed? I.e., they are already determined and do not need to be forecast.
If you were making a forecast in July 2015 for the 2015/2016 marketing year balance sheet, which columns (if any) should remain fixed?